Dashboards
The sales dashboard for cold calling. Who dials, who talks, who books meetings.
Coldfire counts every dial, every task and every meeting, and calculates talk share, monologue and questions from every call. From that you build dashboards for the whole team and for each agent. No spreadsheet anyone has to maintain.
No setup fee · cancel anytime
- 9
- widget types, from single metric to funnel
- 6
- widgets on the starter dashboard, from day one
- 5
- conversation metrics per call, analyzable per agent
- 1.5M+
- dials made through Coldfire since 2023
Why team leads often coach blind
01
The numbers come too late
At the end of the month someone counts in a spreadsheet who called how much. By then the weak month is already over.
02
Dials don't say much
Two callers with the same number of dials aren't equally good. Whether one only talks and the other asks questions shows up in no call list.
03
Everyone needs different numbers
Management wants meetings, the team lead wants talk time, the caller wants their own week. One fixed report fits nobody.
Dashboards in one minute
From the starter dashboard to your own team table: one run in the Coldfire demo workspace.
All companies, people and numbers shown are demo data.
How it works
- 1
Open the starter dashboard
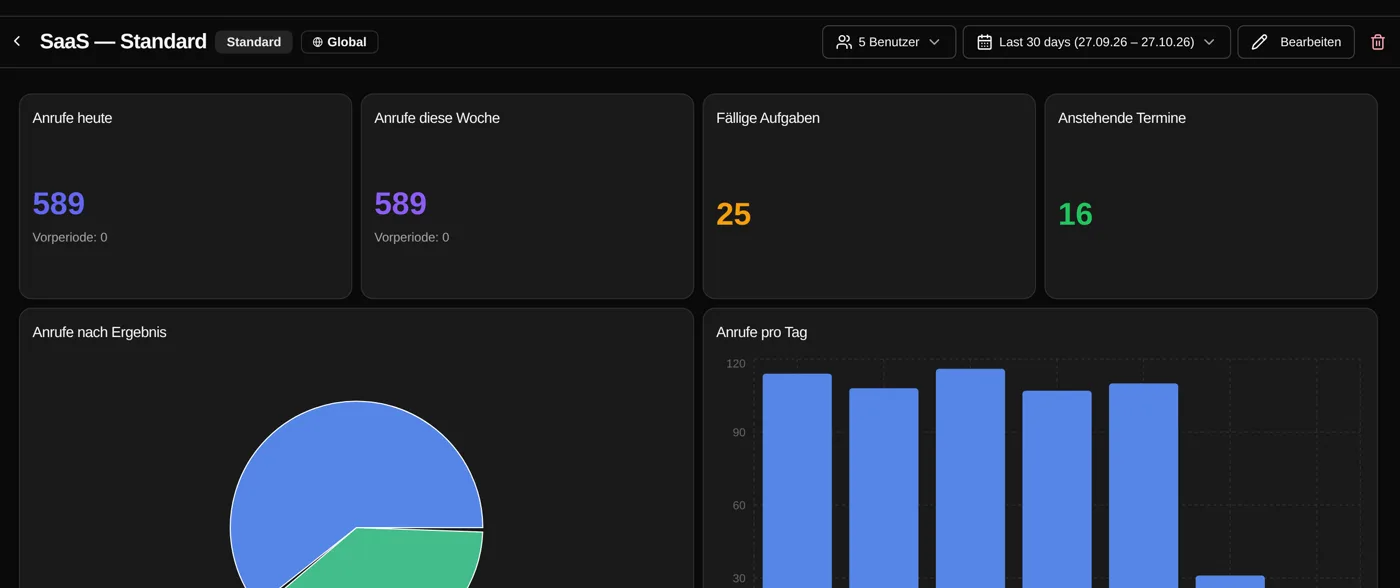
From day one Coldfire shows calls today and this week, tasks due, upcoming meetings and calls per day.
- 2
Add a widget
Pick a type and a data source: calls, tasks, leads, contacts, meetings or call documentation. Then the metric and the grouping.
- 3
Arrange
In edit mode you drag widgets into place and resize them. You can create as many dashboards as you like.
- 4
Share
Make a dashboard visible to everyone or assign it to individual colleagues, even as their default.
What you can analyze in Coldfire
Nine widget types
Single metric, bar, line, area, pie, donut, table, funnel and online users. Counted, summed, averaged, or as minimum and maximum. Grouped by hour, day, week, month or year, by agent or by field.
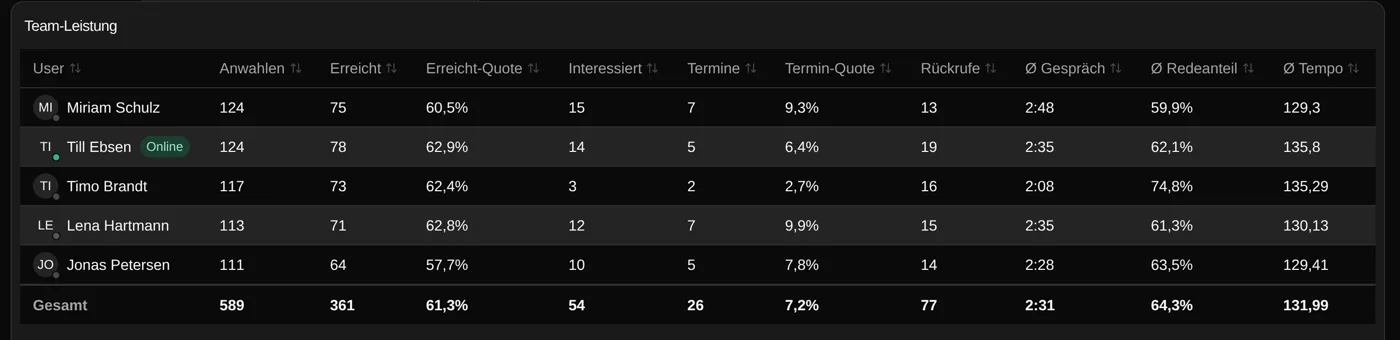
Team table with one row per agent
In multi-column mode each column comes from its own source: dials from calls, meetings from the calendar, tasks from the task list. Rates such as meetings per dial become their own column, “Rate (A ÷ B in %)”.
Conversation metrics for coaching
For every call, Coldfire calculates talk share, longest monologue, questions, speaking pace and filler words per minute. On the dashboard you see the average per agent or the trend over the weeks. So you spot who talks too much and asks too little.
Date range and comparison
One date range applies to the whole dashboard, from today to this year or any custom range. Individual widgets can have their own. Single metrics can show the comparison with the previous period.
Filter by team member
One filter narrows the whole dashboard to individual colleagues. People who left the team are hidden per widget with “Only current team members”.
Who's on the phone right now
The online users widget shows who is online right now, whose phone is ringing and who is on a call. With the right permission you listen in on a live call straight from the dashboard.
Share, assign, duplicate
Make dashboards visible to everyone or assign them to individual colleagues. Everyone sets their own default dashboard. “Duplicate” turns a good dashboard into the template for the next one.
Templates to start from
Besides the starter dashboard there are two templates: “Call Performance” with calls, connected calls, average talk and ring time, and “Team Activity” with tasks, new contacts and new leads.
Who it's for
Team leads
You see per agent how much gets dialed, how many meetings come out of it and how the calls go. The calls worth listening to are then in the call history.
Management
One dashboard with the numbers that matter to you: dials, meetings, the trend over the weeks. Without anyone maintaining a spreadsheet.
Callers
Your day at a glance: calls today, tasks due, upcoming meetings. Dashboards are included in both the Solo and the Team plan.
Spreadsheet by hand or Coldfire dashboards
| Spreadsheet by hand | With Coldfire | |
|---|---|---|
| Dials per agent | counted at month end | for any period, no counting |
| Meeting rate | maintain a formula | rate column calculates itself |
| Call quality | gut feeling | talk share, monologue, questions per agent |
| Comparison with last week | a second spreadsheet | comparison with the previous period |
| Who's on the phone | ask around | online users widget |
| Numbers for the team | email a file | share or assign a dashboard |
Questions about dashboards
Try Coldfire free for 14 days.
Import your leads, connect your phone line, make the first call. Cancel anytime.
